


Reposting an article I wrote a year ago about proper saving & investing. Before stock markets fell 20%. The piece still stands.

Remember, the following article is coming up to its first birthday.
Chris Johns
Hubble, bubble…

Lots of people think there is a stock market bubble. Here (£), for instance, is respected FT investment columnist Merryn Somerset Webb. And this is what she thinks investors should do:
The bubble may well keep going for some time — inflation is great for equities, particularly when companies are highly leveraged and private equity is cashed up and active. Also on the plus side is the fact that some things are less expensive than others. .. Pick the least expensive stocks with the most obvious income-producing potential — Japanese, British and emerging market equities over US equities, and value over growth. It might not feel great immediately. But long term you are unlikely to regret it. History is pretty clear on this one
Some major stock markets have been busy going nowhere for a while now, with pundits attributing listlessness to a variety of factors. The economic consequences of surges in coronavirus infections are at, or near, the top of the list of concerns. Even if growth doesn’t suffer too much because of a new Covid wave, there are plenty of forecasters who still think most of the good economic news is behind us and therefore ‘in the price’. And those ‘bubble’ fears nag away at most professional investors. ‘Waterbed’ markets include Japan’s Nikkei, Germany’s Dax and the UK’s FTSE100
Japanese equities over over past 6 months (slightly down)

German equities over past 3 months (slightly up)

UK equities over past 3 months (ever so slightly up)

These are varying and short time periods. If you stare hard enough at two of these charts you might conclude there is a very small tendency to rise rather than fall amidst the daily ups and downs. A statistician would say there isn’t much in it, either way. Draw these charts over long enough time periods and they will always show a rising trend - that’s what equities do. Hold them for long enough and you will make money, historically at least.
Nobody knows what ‘long enough’ amounts to. But long can mean very long. The FTSE100 has hardly risen at all since September 1999! It’s a peculiar if popular index, not really representative of the UK economy, very currency sensitive and has given investors healthy dividend but not capital return.
For traders - day-traders in particular - these charted short periods are lifetimes. Day trading and most forms of short-term trading, in the opinion of this analyst, are likely to be life-shortening and wallet-emptying experience. But like all casinos, there will be lucky winners or a vanishingly small number of very skilled winners.
The most important market: bubble or not?
US equities over past 12 months
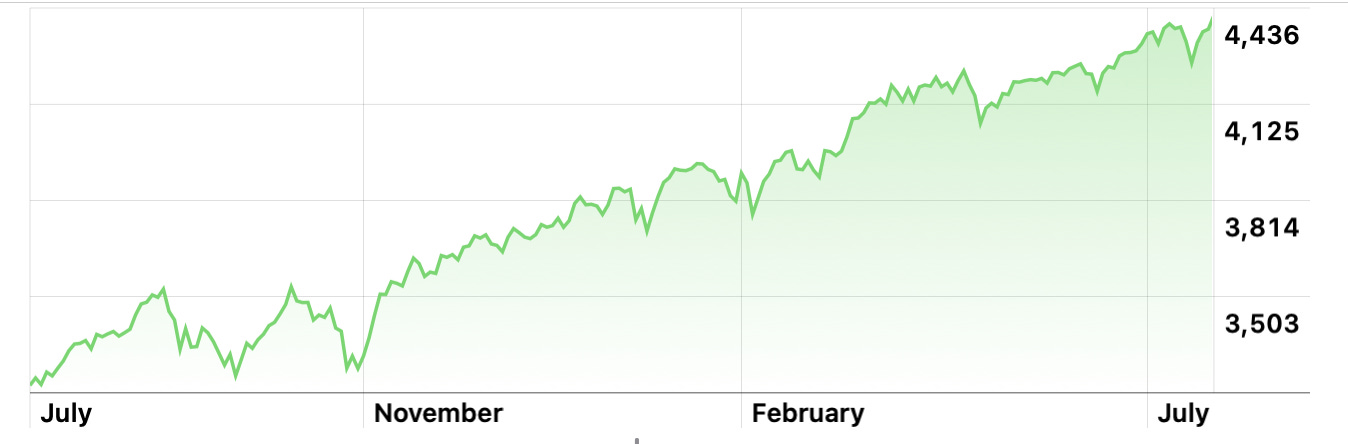
One major market did, however, just set a new all-time high. America’s stock market is the one that elicits most alarm; it is the one that analysts are most worried about. But is the one that just keeps going up. A perennial worry is valuation: stocks look over-valued. But the US market just keeps going up.
Equity (or any other asset) valuation is complicated. A popular way of illustrating the issue is the next chart taken from Nobel-prize winning economist Robert Shiller’s website. He calculates a version of one the simplest valuation measures and places it in historical context.
The PE ratio looks at a share price (in this case the price of the whole market) and compares it to the profits (earnings) of that asset. (Shiller also does a couple of simple adjustments for inflation and the effects of the business cycle.) The chart is popular, particular with those who think that the US equity market is in ‘bubble’ territory and destined for a big fall. It has its critics, particular those who think the US equity market is not going to implode.
The chart looks at Shiller’s PE ratio and compares it to government bond yields. The latter attract less attention than equities in the popular financial media - they are less exciting - but, along with the growth outlook, they are the ultimate driver of all asset prices. There is a connection, albeit one that is much debated, between the current low level of long term interest rates and the high level of valuation metrics like Shiller’s PE.
The simple message of the chart is that US equities, compared to today, have only ever been more expensive in March 2000. That was the peak of the dot.com bubble: when that burst, stocks went into a bear market that lasted for roughly three years. Today, the US stock market is at a more extreme level than just before the 1929 crash.

There are plenty of people who think the US market is headed for trouble. Prominent amongst them is Jeremy Grantham of asset manager GMO. His latest thoughts can be found here. He has been convinced about a bubble for some time and has, so far, been wrong. Here is the money quote:
The long, long bull market since 2009 has finally matured into a fully-fledged epic bubble. Featuring extreme overvaluation, explosive price increases, frenzied issuance, and hysterically speculative investor behaviour, I believe this event will be recorded as one of the great bubbles of financial history, right along with the South Sea bubble, 1929, and 2000.
Grantham - and all the other bubble warriors - could be right. This analyst is prepared to admit that he has no idea. But this analyst is also convinced that nobody else does either.
One important feature of most, if not all, valuation measures: they are hopeless if used to try and time the market. But plenty of people describe themselves as value investors. The FT journalist quoted at the top of this blog would seem to fit the bill. The results from value investing are often miserable. You are wrong more often than you are right. Lots of money can be made if/when you are, eventually, right but you might go bust before that happens. But who can argue with trying to buy cheap/sell expensive? Sounds simple and obvious but it usually isn’t.
Stories
We rationalise stock market behaviour via stories, or narratives, to explain the ups and downs. Most of the time, even for pretty long periods of time, we don’t have much of an idea of why equities - or most other markets - do what they do. To repeat: we make up stories that seem to fit observed asset prices.
Shiller’s chart enables us to tell plausible sounding stories. World Wars, at least when they start, are not good for stocks. The 1970s, a period of high inflation and so-so economic growth (‘stagflation’) was not a good decade for most investors - that looks interesting in the context of today’s controversies over the inflation outlook. But it’s also the case that stocks go up or down for no apparent reason.
Inflation and valuation are today’s narratives. There are plenty of others. They will all be succeeded by new narratives. Lots of people will make lots of money as story-tellers. We know that much but not much more.
For our narratives we mine the data, hopefully finding something that can be put into a pretty chart, something that goes up when equities go up. And vice versa. The correlation might imply causation but usually doesn’t. Even if it it does, we might not know why. If we can’t find correlations, we look for events. Finance ministers saying something about taxes; central bankers proclaiming about inflation prospects; Presidents invading small countries. That sort of thing.
Our explanations - stories - risk becoming ‘narrative fallacies’, a crime that Nassim Nicholas Taleb, of ‘Black Swan’ fame, famously accused most economists of committing most of the time.
Not all correlations are spurious, nor are all explanations fallacies. Unfortunately, only until long after the event do we ever establish the truth. Sometimes we never do. Despite many an enquiry, nobody is sure what caused the 1987 crash, for example. It looks like the 1929 crash correctly anticipated the Great Depression but it might just be that the stock market drove the economy down. Erroneous beliefs about house prices going up forever led to the Great Financial Crisis. But nobody knows why that catastrophe started when it did. That crisis ended in March 2009 but few realised it at the time.
It’s tempting to conclude that nobody knows anything. But that wouldn’t be quite right. Super sophisticated mathematics can help us distinguish between causation and correlation. And regular correlations can be exploited by investors, even if we don’t quite know why they occur. Not all narratives are false.
What is the ordinary investor to do?
How can the ordinary investor make any sense of all this? What investment strategy should she adopt? Is it just a matter of throwing a dart at a list of plausible narratives?
Key to good investment outcomes is an appreciation of the complexities. We must be humble about our ability to forecast the future. Avoiding poor behaviours and following some simple rules of thumb - consistently - can lead to investment outcomes that are good enough. Those last two words strictly imply that managing our expectations is vital: good outcomes are much easier to achieve than perfect ones.
Even when we say we know all this, when we acknowledge our limitations and admit that we simply know very little, we can’t resist the narrative. Our need for things to make sense, to have an explanation, extends far beyond financial markets and causes all sorts of trouble. The abundance of religious narratives and multiple gods causes humanity the odd spot of bother, for example.
Just as we buy lottery tickets despite knowing how the odds are stacked against us, we search for the market guru to give us that stock market tip, the future of house prices, the route to quick riches.
Most ordinary investors don’t have access to the super-secretive hedge funds who use sophisticated mathematical tools to discover the hidden correlations, the secret sauce. But there are tried and tested rules-of-thumb that can help.
It is almost beyond cliche to talk about time and diversification. Almost but not quite.
Any investor must have a belief about the future. That’s not the same as a forecast (don’t bother with that dark art). As a natural optimist I believe that economic growth will continue. That means I am prepared to invest in the future. I am, like everyone else, ignorant about the precise nature of that economic future. So I need to hedge and spread my bets. That brings us to diversification.
The pessimists could be right: we might be living through a massive asset price bubble, brought on by all that central bank money printing (quantitative easing). If I believed that, I would sell some equities or, at the very least, not commit fresh cash to the market. If I go down this route I must be confident of two things. First, now is the right time to do this and, second, I have the knowledge and skill to get back into the market at the right time. So, I have to get two big decisions right. It’s great to be out of a market when it is going down but not so great if I miss any subsequent bounce.
If you think you have this much skill then go ahead and invest accordingly. I am pretty sure that I don’t possess this skill.
What I am sure about is that for one reason or another (maybe valuation, maybe something else) stocks will go through another bad time, perhaps losing 30% or more. That’s a belief, based on nothing more on what stocks do historically and that point about current US valuations. But I have no idea when this will happen. But it might not. Again, based on history, I am confident that equities will recover from big losses. Some individual companies will not, but markets will. I have no idea how long this process will take.
To be invested in equities you need to have that belief in the future and a time horizon that is long enough. And an awareness that ‘long enough’ could be very long indeed. There is no such thing as a sure bet, but the longer you can wait, the better your odds.
So, spread your bets, keep your costs as low as you can by buying index funds (which also helps diversification). If you have enough belief in a particular asset manager, pay up for a (concentrated is my preference) stock portfolio that is part of your well diversified strategy. If you need cash over the next few years, don’t put it in the stock market. The more years you can wait, the more you should put into stocks. There is no magic number - it’s partly down to individual risk preferences.
I always have something in the market and vary it depending on my own narrative. I probably shouldn’t do this but it keeps me off the street.
I also have a pension fund which I hardly ever touch as I hope not to need the money for at least a decade, probably longer. But those are my preferences - they may not be yours.
My own narrative is essentially an optimistic one. In particular, I believe all sorts of technological developments mean the future is brighter than many pessimists would have us believe. I acknowledge the bubble fears so I am not ‘all in’. If stocks do go through a bad time I intend to invest more. A particularly bad investor behaviour is not investing during tough periods. Sounds easy until you try buying in the middle of the storm.
I pay attention to all the narratives out there but I don’t obsess about them. I think most of them (including mine) will be wrong. And I have no ability today to spot which ones, if any, will be right. But my core belief is that there is an economic future and I should be invested in it.
That’s it. Apart from a few simple rules, investing is mostly about narratives. Wrong ones. Pay attention to what is important.